Difference between revisions of "Handbook"
(→Using the GREENFOODS WikiWeb) |
(→Using the GREENFOODS WikiWeb) |
||
| Line 122: | Line 122: | ||
{| class="wikitable" | {| class="wikitable" | ||
|- | |- | ||
| − | | [[File:fig_WikiWeb_1.png]] || style="text-align:right" | + | | [[File:fig_WikiWeb_1.png]] || style="text-align:right"style="width: 10em"|→ || [[File:fig_WikiWeb_2.png]] |
|} | |} | ||
Revision as of 16:27, 12 May 2015
THIS HANDBOOK IS STILL IN PROGRESS
Contents
- 1 General Description of Tool
- 2 Working with the GREENFOODS branch concept
- 3 Defining the Status Quo - Energy Balancing in the GREENFOODS branch concept
- 4 Optimisation
- 5 Results
General Description of Tool
Working with the GREENFOODS branch concept
Download and Start the GREENFOODS branch concept
You can download the GF BC from the homepage of the GREENFOODS project green-foods.eu and from the national VECC (listed in Annex).
The GF BC is an Excel Tool. There is now need to ‘install’ the tool. Make sure you save the file in a directory where you do not need administrator rights. Open the GF BC with an ordinary double-click on the file.
You may need to activate the contents or allow macros to be activated.
You will see following screen. Start the GF BC with a click on the green error.
Selection a Branch in the GREENFOODS branch concept
You may select any of the 5 branches in the GF BC.
File:Fig branchconcept branch.png
Once you select a branch you are immediately forced to save the Excel-File as a new version.
After this initial saving process you will have two versions of the GF BC:
- Version 1: The original version. It is now closed. No branch is selected. It can be used for new projects.
- Version 2: The current version. It is now open. A branch is selected which cannot be changed in this version.
Effects of the branch selections
- The general input form will be individualized to the selected branch
- The benchmark data is individualized to the selected branch
- The relevant processes are activated for the selected branch
- WikiWeb information (buttons) are individualized
Saving your work
| How to... | |
| ...save as new file | 1) when selecting a branch in GF BC
2) when clicking “save as new file” in the “branch selection” form |
| ...save changes in a form | by clicking on the (dark green) button “Confirmed” (the changes are saved in the workbook) |
| ...save workbook (Excel-file | use the common Excel-buttons or the shortcut Strg+S for savings |
Selection a Branch in the GREENFOODS branch concept
Forms: Entering data in the GREENFOODS branch concept
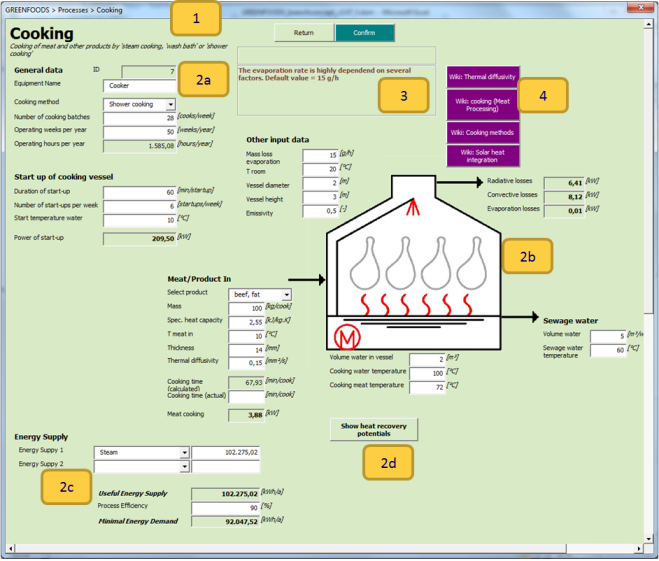
The graphical user interface of the GF BC is built in userforms (hereafter called “forms”). By using the buttons explained above, the various forms can be accessed.
| Number | Name | Explanation |
|---|---|---|
| 1 | Top bar + Headline | The top bar of the form shows the navigation place of the form (e.g. … > Processes > Cooking)
The headline is supported with additional information on the particular form. |
| 2a | Entry: General | All process-(or utility-)forms will receive a new process-(or utility-)ID. A name must be entered for each process/utility. |
| 2b | Entry: Energy demand | The energy demand of the processes can be calculated in different ways. The calculation is supported by flowsheets or images for better understanding. |
| 2c | Entry: Energy supply | The defined energy demand must be met by energy supply. This section is identical in all process and utility forms.
In utility forms, all energy sources can be selected as energy supply. In process forms, all distribution lines can be selected as energy supply. |
| 2d | Entry: Heat recovery | Heat recovery optimization is an important part of the GF BC. Each provides different heat sinks and heat sources. |
| 23 | Info: Quick | By moving the mouse over fields and images the user gets additional information on the meaning of the field and the required input. |
| 4 | Info: WikiWeb | Most forms have several links to the WikiWeb indicated by purple color. |
The X-Button on the top right corner will close the form. The changes of the current form will NOT be saved. However, all previously saved forms will be available for further processing. The user can immediately start the BC again by click on the green start arrow.
 |
dark green | confirmation / changes are saved |
 |
light green | returning / changes are not saved |
 |
red | economics / optimization / benchmark |
 |
purple | hyperlink to GF WikiWeb |
Fields: color code and mandatory data
| Number | Name | Explanation |
|---|---|---|
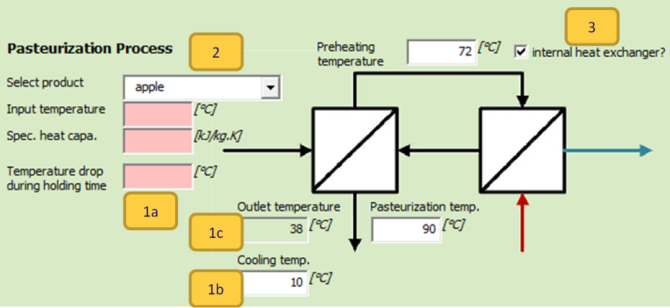
| 1a | Mandatory field (red) | Mandatory fields must be filled in order to start the calculations and save the changes |
| 1b | Filled mandatory fields (white) | As soon as mandatory fields have valid data filled, the color changes to white. However, certain restriction might lead to a recoloring to red again.
Some fields are white from the beginning, meaning that the entry is not mandatory but optional. |
| 1c | Calculated fields (green) | Green fields are calculated based on the entries in the other fields |
| 2 | Combination boxes (red/white) | Combination boxes allow the selection of pre-defined data. Similar to ordinary fields, they may be mandatory (red) and after selection become white. |
| 3 | Check boxes | In various areas of the different forms, there is the possibility to activate/deactivate additional options. |
Using the GREENFOODS WikiWeb
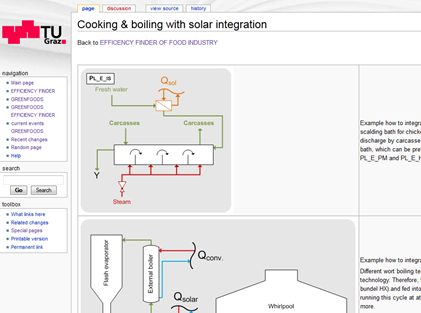
The GREENFOODS WikiWeb can be accessed in many multiple areas of the GREENFODS branch concept, indicated by violet buttons.
 |
→ | 
|
Defining the Status Quo - Energy Balancing in the GREENFOODS branch concept
General Imput
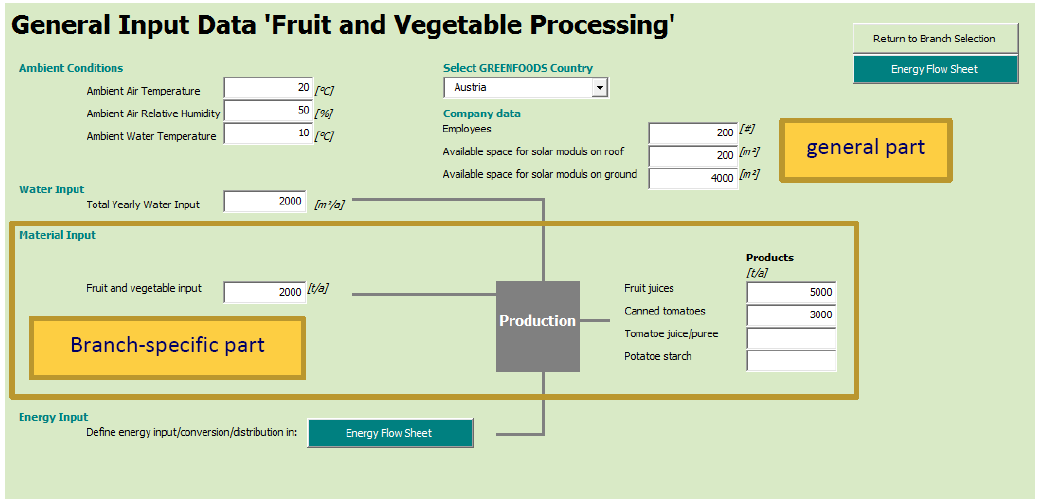
In the general input section some basic data must be entered:
- Ambient Conditions
- Country
- Company Data
- Water Input
- Material Input (branch specific)
- Energy Input --> Linked to the Energy Flow Sheet
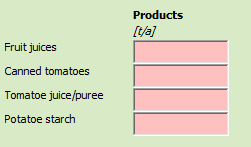
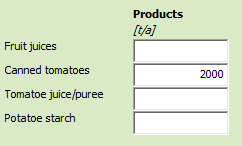
At least one product must be defined in the “material input” section:
Energy Imput
In the GREENFOODS branch concept, 10 energy sources can be selected and a 11th added by the user with individual configurations.
Processes
process xy
Description of process Method of calculating energy demand Formula to determine energy demand Embedding in branch concept
Baking Oven
Description of process The baking process transforms an unpalatable dough into a light, readily digestible, porous flavourful product. The physical activities involved in this conversion are complex but the fundamentals of these are explained here: Information about bread The internal loaf temperature increases to reach approximately 98°C. The loaf is not completely baked until this internal temperature is reached. Weight is lost by evaporation of moisture and alcohol from the crust and interior of the loaf. Steam is produced because the loaf surface reaches 100°C+. As the moisture is driven off, the crust heats up and eventually reaches the same temperature as the oven.
Method of calculating energy demand The unit operation “baking” is related to the drying operation. The process involves the evaporation of water in the dough which is known as the baking loss.
The baking loss is the ratio between water loss during baking and dough input.
Additionally, at the beginning of the baking process steam is supplied to the baking oven for better heat conductivity of the baking goods. If the required steam is generated by the baking oven itself (e.g. internal electrical steam generator) then the necessary energy demand is calculated. If, however, steam is supplied directly from a stream distribution line, then the respective amount of energy must be assigned in the energy supply section. The heating of the cold dough is also considered in the energy demand.
File:Fig processes bakingoven.png
For the startup of the oven only the heating of the air is considered, but not the heating of oven-material.
Heat losses are comprised of radiative and conductive heat losses.
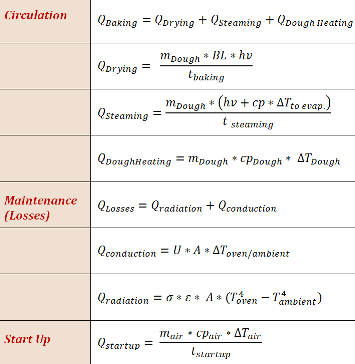
Formula to determine energy demand
Where:
| Formular | Description | Unit |
|---|---|---|
| Q(Baking Oven) | Baking Power | [kW] |
| m(Dough) | Mass input of dough | [kg/batch] |
| BL | Baking Loss | [kg water / kg dough] |
| hv | Evaporation enthalpy water | [kJ / kg water] |
Embedding in branch concept
- The total dough input of 4 baking goods can be defined in the “General Input” form. The definition of the baking loss is also defined there.
- The energy supply is likely to come from different sources (e.g. thermo-oil for baking power, steam inlet for steaming, electricity for lighting)
- The usage of the remaining vapors (from the steaming) for heat recovery is a key energy efficiency measure in bakeries. The condensation enthalpy of the steam is added to the pinch stream list. Currently, only the condensation enthalpy at 100°C is considered in pinch analysis.
Pasteurization
Description of process Pasteurisation is a controlled heating process used to eliminate any dangerous pathogens that may be present in milk, fruit-based drinks, some meat products, and other foods which are commonly subjected to this treatment. Pasteurization inactivates most viable vegetative forms of micro-organisms but not heat-resistant spores. As well as the application to inactivate bacteria, pasteurization may be considered in relation to enzymes present in the food, which can be inactivated by heat (BAT in the Food, Drink and Milk Industries, June 2005) Pasteurisation is used to treat all types of food products. These include milk, juices, beer and many others. [[1]]
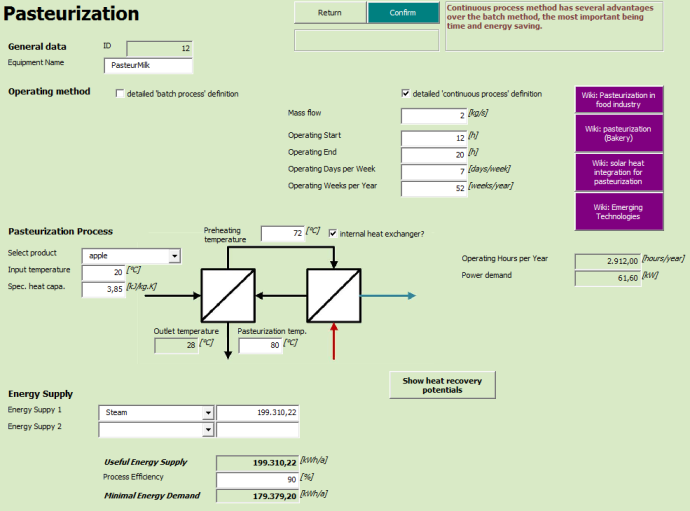
Method of calculating energy demand In order to calculate the energy demand of pasteurization, the user has 4 options:
- Batch process with no internal heat exchanger
- Continuous process with no internal heat exchanger
- Batch process with internal heat exchanger
- Continuous process with internal heat exchanger
Energy is needed to heat up the medium to the pasteurization temperature and hold it for several seconds or minutes.
Formula to determine energy demand
 Embedding in branch concept
- For heat recovery the heating of the product is added as a pinch stream (if there is already an internal heat exchanger the remaining heat demand is added). Similarly, the cooling of the product after pasteurization is also added as a pinch stream.
- All available energy sources can supply to this process
- Additional information on emerging technologies in this area is available in the WikiWeb.
Space Heating and Cooling
Description of process Production halls and offices have to be heated and increasingly commonly cooled. Space heating and cooling can be done by ordinary radiators, surface heating or ceiling spots. The equipment are supplied with a hot medium, some may be driven electrically. Heating and cooling of production halls and offices can have a high share of the energy demand in less energy intensive production facilities. It can be an important heat sink for waste heat integration.
Method of calculating energy demand In order to determine the energy demand for heating and cooling the production facilities and offices the area [m²] and specific heating/cooling demand [kWh/m².a] can be entered. Additionally, heating/cooling hours as well as supply and return temperatures are defined so the data can be used as heat sinks and sources in the heat integration analysis.
File:Fig processes space define.png
Multiple areas can be defined which have heating and/or cooling demand. The areas are listed in a heating and a cooling section and can be edited or deleted anytime.
File:Fig processes space areas.png
The “total space heating demand” and the “total space cooling demand” require a connection with an energy supply from the distribution list. It is possible to define 3 energy supplies. If both heating and cooling takes place then at least one “heating source” and one “cooling source” must be assigned, additionally a third source (either heating or cooling) may be selected.
Formula to determine energy demand
Where:
| Formular | Description | Unit |
|---|---|---|
| Q | Energy demand | [kWh/a] |
| q(i) | Specific energy demand of space | [kWh/a.m²] |
| A(i) | Area of space | [m²] |
| i | space Number |
Embedding in branch concept
- The energy supply may be split into heating and cooling sources
- Space heating is an important heat sink for heat recovery measures in many cases. It is added as a cold stream in the heat recovery analysis. The extracted heat from cooled spaces can technically serves as heat source for heat recovery or heat pumps, but it is not likely to be actually used. However, it is still included in the stream list as hot stream.
Optimisation
System Optimisation
For the system optimization of the company under investigation the GREENFOODS BC has incorporated a Pinch Analysis, which is a methodical approach of identifying heat recovery potentials and setting up a heat recovery network. For Pinch Analysis it is necessary to retrieve all possible thermal energy streams that must be either heated up (=cold streams) or can/must be cooled down (=hot streams). The summary of this streams is called the pinch stream list. There are 2 ways to get the data for the pinch stream list:
- The GF BC automatically retrieves the data of hot and cold streams from the process and utility definitions while setting up the energy balance of the status quo.
- In the Pinch Analysis Form, the user can add extra streams that are not considered in the energy balance before.
File:Fig optimisation SystemOptimisation PinchAnalysis.png
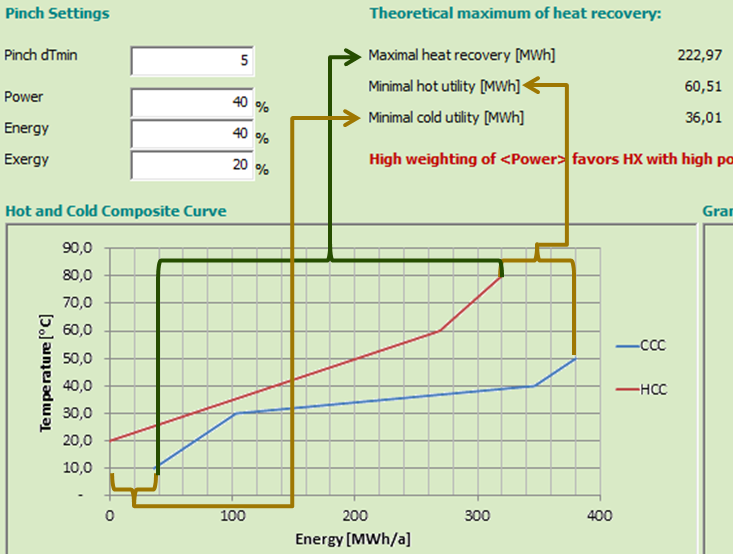
Via vectorial addition, all hot streams are combined to the “hot composite curve” = (HCC) and all cold streams are combined to the “cold composite curve” = (CCC).
It is important to note that the Pinch Curves show only the process and extra streams but not the utility streams.
| Input field | Explanation |
|---|---|
| Pinch dTmin | Minimal temperature difference of heat exchangers in the heat recovery network to transfer heat from the hot side to the cold side.
Thus, the HCC must have the same distance to the CCC at the narrowest point. This point is called the Pinch which gives this method its name. |
| Criteria for Heat Exchanger Network | The 3 criteria must sum up to 100%. They determine the ranking of suggested heat exchangers in the next form. |
| Power | HX with high thermal power [kW] are favored. |
| Energy | HX with high energy transfer [MWh] are favored. |
| Exergy | HX with little temperature difference between hot inlet and cold outlet are favored. |
| Maximal heat recovery | Theoretical maximum of heat recovery at given deltaTmin. |
| Minimal hot utility | Theoretical minimum of hot utility if all heat recovery potentials are exploited. |
| Minimal coldutility | Theoretical minimum of cold utility if all heat recovery potentials are exploited. |
The Grand Composite Curves gives better insights in the placement of utilities and the actual required temperature level of the processes.
Integration of Renewables
Solar Thermal Heat for Industrial Processes
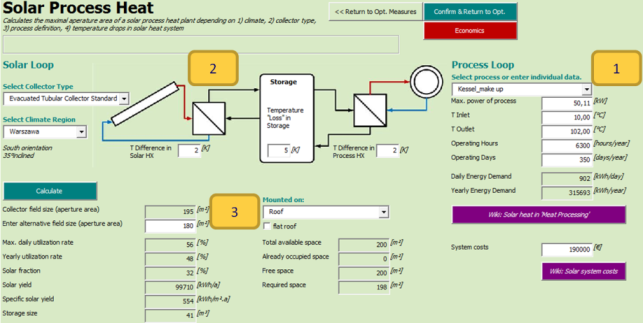
| Number | Name | Explanation |
|---|---|---|
| 1 | Process Loop | Cold streams can be selected in the combination box (thermal power, temperatures and operating hours are loaded in the fields below) |
| 2 | Solar Loop and Solar Storage | In order to provide heat to the selected process, different climate regions and temperature drops in the supply network can be defined.
4 different collector types can be compared. |
| 3 | System performance | After clicking the ’Calculate’ button the collector fields size and the required mounting area (besides other key solar performance indicators) are calculated. The required mounting area is compared with the available space defined in the General Input form |
Photovoltaic
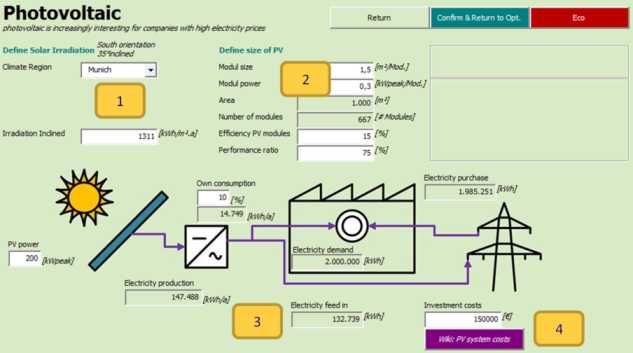
| Number | Name | Explanation |
|---|---|---|
| 1 | Define Climate Region | The inclined irradiation of the selected climate region is automatically generated. It may be adapted by the user for specific regional or inclination settings. |
| 2 | Define PV system | Typical module configurations can be entered. Information on typical values is given in the Info-box on the right hand side. |
| 3 | Define PV integration | The PV power can be varied and its effect on the company examined. The electricity demand is compared with the new PV system. |
| 4 | PV system costs | Information on typical PV system costs is given in the WikiWeb. In the Economic Analysis the whole electricity generated by the PV system is taken into account. |
Biogas
Biogas is an important potential for renewable energy production in the food and drink industry.
Details on biogas production: [2]
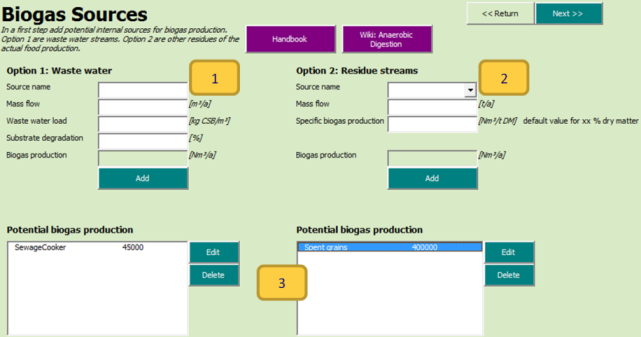
Step 1: Biogas Sources There are 2 different types of biogas sources: Option 1: waste water
| Input field | Explanation |
|---|---|
| Mass flow | Mass flow of the waste water stream |
| Waste water load | The COD (chemical oxygen demand) of the waste water must be entered |
| Substrate degradation | Percentage of the utilization of the COD potential |
For more information see: [3]
Option 2: residue streams
| Input field | Explanation |
|---|---|
| Mass flow | Yearly mass flow of the biogas source material |
| Specific biogas production | Biogas production per ton of dry material (DM) – default values are given when choosing a source |
See also Table 8 in following link: [4]
In the screenshot below can be seen how the biogas production of the two possible sources (1 and 2) is summed up and is ready for further editing (3).
Step 2: Biogas Utilization
Key rule of the thumbs values can be found here (German): [5]
Or here (English): [6]
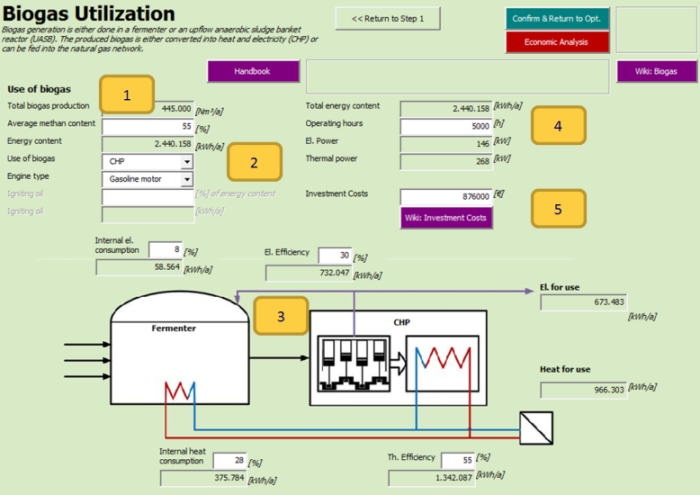
| Number | Name | Explanation |
|---|---|---|
| 1 | Amount of biogas | The total biogas production origins from the first step (biogas sources). Here, the ‘average methan content’ must be entered which is usually between 53-67 % as indicated in the info-box. |
| 2 | Biogas utilization | In the ‘use of biogas’ box only CHP can currently be selected. Biogas feed-in would be another method which can currently not be examined.
The engine type can also be selected. The igniting beam engine needs an additional energy source. |
| 3 | CHP definition | In the CHP flow sheet the thermal and electrical efficiency must be entered as well as the internal energy demand for the fermenter. Information on typical values is given for all fields. |
| 4 | Power and operating hours | The operating hours of the CHP must be entered. Electrical and thermal power of the CHP is calculated. |
| 5 | Investment costs | Based on the electrical power, the investment costs for the biogas fermenter + CHP can be estimated with the help of the WikiWeb |
Biomass CHP
In order to fulfill the target of the GREENFOODS project of going toward zero-fossil fuels in the food and drink industry, only biomass CHPs can be examined in the GF BC and not natural gas CHPs which are generally also considered as an efficiency improvement, however still based on fossil fuels.
More information on biomass CHP in industries can be found here: [7]
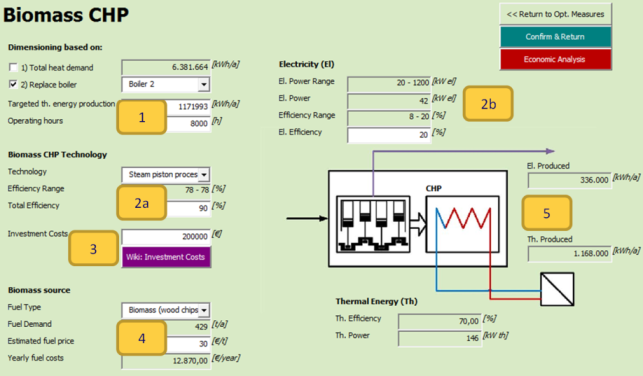
| Number | Name | Explanation |
|---|---|---|
| 1 | Dimensioning of biomass CHP | The biomass CHP can be dimensioned in 3 ways:
Option 1: Based on the total heat demand Option 2: Based on the replacement of one existing boiler Option 3: By entering an individual targeted thermal energy production |
| 2a + 2b | Biomass CHP technology | 8 different biomass CHP technologies can be selected. Some are in an experimental stadium, some have proven their applicability in practice. Depending on the selection, efficiency and power ranges are given. The user must enter the exact values manually. |
| 3 | Investment costs | The investment costs are given for each technology in the WikiWeb |
| 4 | Biomass source | Wood chips are the default biomass fuel type. The fuel demand is calculated automatically with an energy content of 3.89 kWh/kg |
| 5 | Energy generation | The produced thermal and electrical energy production is calculated based on the efficiencies, the targeted energy production and the operating hours. |
Heat Pump
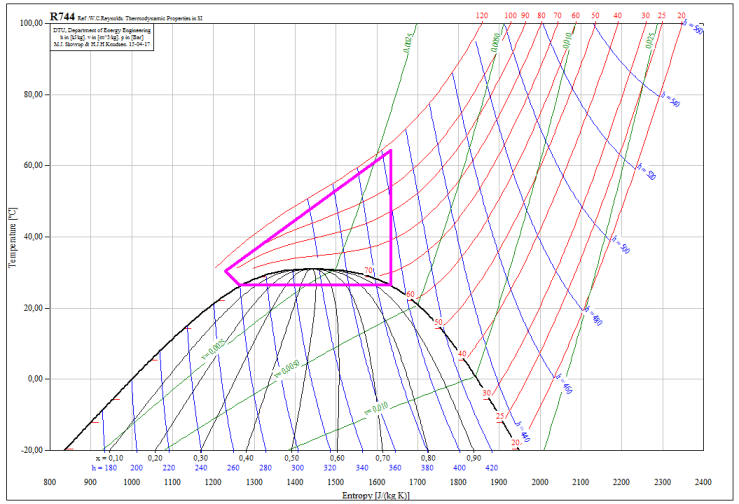
The heat pump module helps us decide if to use a heat pump to lift the temperature of a heat flow to heat up another heat flow. A low temperature waste heat flow can be upgraded to useful high temperature heat with the use of a heat pump. The mechanical heat pump type is the most commonly used. Its principle is based on compression and expansion of a refrigerant.
For large scale industrial applications, Ammonia is the most suitable refrigerant for heat pumps that deliver heat up to a temperature of 90 °C. Ammonia is considered to be one of the most efficient refrigerants. However its use comes with certain safety measures. Therefore Ammonia is mainly used for large industrial installations. The choice of refrigerant for a certain application is determined by the temperature range of its thermodynamic cycle and the size of the installation needed. Refrigerants can be divided into two groups: natural refrigerants (Butane, Ammonia, CO2) and synthetic refrigerants (R134A, R407C, R410A). For commercial applications synthetic refrigerants are favoured over natural ones. A disadvantage of synthetic refrigerants is their strong contribution to the greenhouse effect in case of leakage. The negative impact of synthetic refrigerants is, for example, 1300-2100 times higher compared to CO2.
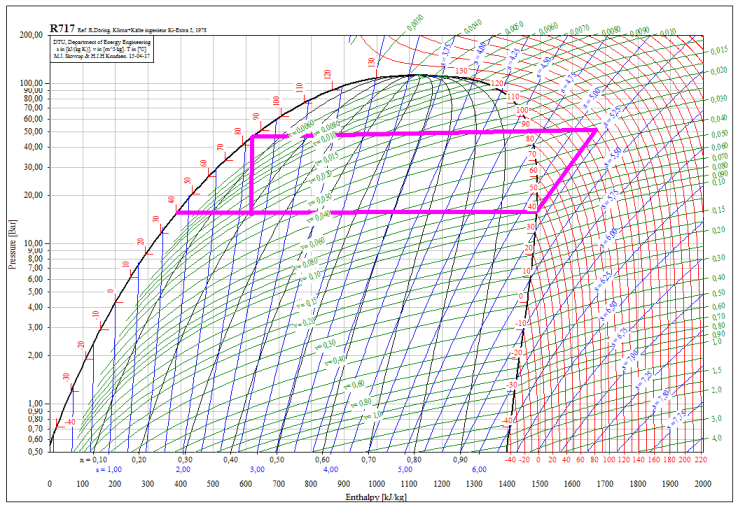
In this tool, we will analyze 3 refrigerants: Ammonia (R717), R134 and CO2 (R744). Although new refrigerants are starting to be used with good performances (R245a), they are still not widely spread, and thus we will limit ourselves in the tool to the three forementioned. The tool will allow the introduction of new refrigerants, either transcritical or non-transcritical.
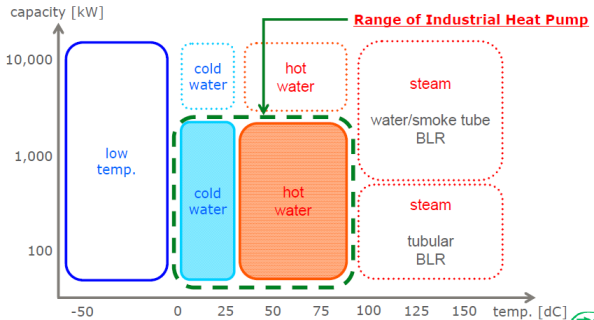
Image from Kobelco, industrial heat pump manufacturers
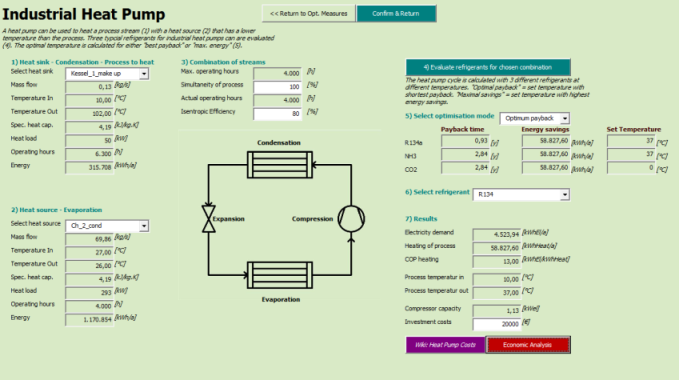
The analysis of the potential of the heat pump in the tool is done using a userform that recovers the data from the different energy flows.
In the left part of the screen, the 1) heat sink (where we will get the heat from) and the 2) heat source (where we will send the heat to) must be selected from the combo lists.
In 3) , we will introduce the percentage of hours where the heat sink and the heat source are operating at the same time. If no simultaneity exists between the flows, the number must be 0. If complete simultaneity exists, it must be 100.
In point 4), a first analysis, based on real life installations (more references in Wiki Heat Pump Costs) is done, to evaluate for the given processes which is the most interesting heat pump refrigerant. Two optimization indicators can be used, either maximum energy recovery or optimum payback.
Once we have seen the results, we select a refrigerant, and the calculation is done, to evaluate the COP, the energy recovery and, given the investment costs we introduce, a payback.
Limits are established as for temperatures.
- R717 and R134 cannot go higher than 90ºC
- For CO2 heat pumps, for a high temperature lift at the side of the gascooler (at least 30-40 °C) and a low temperature of the water that needs to be heated, the efficiency of a CO2 transcritical heat pump can be higher than conventional heat pumps. If the return temperature is higher than 30ºC, it cannot be used.
Results
| Catogory | Surface | Emissivity |
|---|---|---|
| metal | silver, polished | 0.03 |
| metal | copper, polished | 0.04 |
| metal | copper, black oxidized | 0.82 |
| metal | aluminium, bright rolled | 0.05 |
| metal | iron, bright etched | 0.16 |
| metal | iron, sanded | 0.26 |
| metal | iron, heavily corroded | 0.85 |
| other | glas | 0.88 |
| other | linoleum | 0.88 |
| other | paper | 0.89 |
| other | wood | 0.91 |
| other | mortar, plaster, concrete | 0.93 |
| other | brick | 0.93 |
| other | roofing felt | 0.93 |
| coating | aluminium-bronze coating | 0.40 |
| coating | oil paint coating, black, matte | 0.97 |
| coating | oil paint coating, black, bright | 0.88 |
| coating | oil paint coating, white | 0.89 |
| coating | radiator coating | 0.93 |

